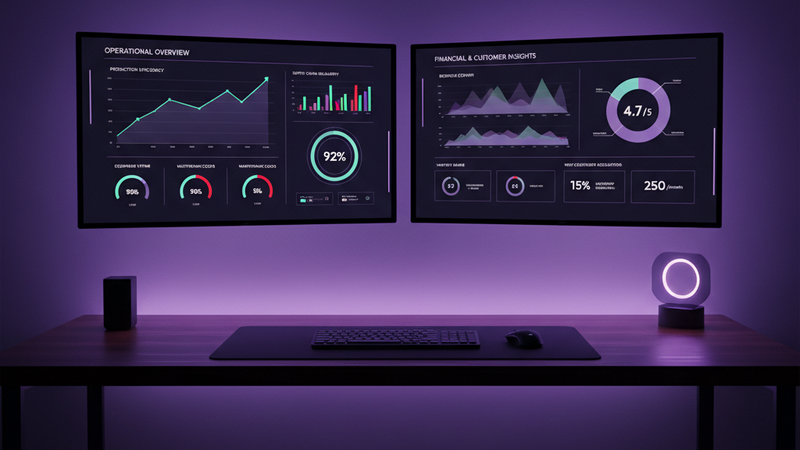
The best KPI dashboards share one thing in common: they show exactly the metrics that matter for that specific business. A SaaS dashboard tracks completely different numbers than a local bakery. There is no one-size-fits-all template.
To help you find the right approach for your business, we have put together 10 KPI dashboard examples across different industries. For each one, we break down the key metrics, explain the decisions it supports, and highlight what makes it effective.
1. E-commerce KPI dashboard
An e-commerce dashboard tracks the health of your online store. The key metrics include:
- Revenue: Total sales over time, broken down by product, channel, and region
- Conversion rate: Percentage of visitors who complete a purchase
- Average order value (AOV): How much each customer spends per transaction
- Cart abandonment rate: How many people add items but do not check out
This dashboard helps you answer: Is my store growing? Which products drive the most revenue? Where are customers dropping off?
2. SaaS KPI dashboard
SaaS businesses need a dashboard focused on recurring revenue and customer retention:
- Monthly recurring revenue (MRR): The lifeblood of any subscription business
- Churn rate: Percentage of customers who cancel each month
- Customer lifetime value (CLV): Total revenue expected from each customer
- Customer acquisition cost (CAC): How much you spend to win each new customer
See our sales KPI dashboard guide for more on tracking recurring revenue metrics.
3. Marketing agency dashboard
Agencies juggle multiple clients. A good agency dashboard shows performance across all accounts:
- Client revenue: Revenue per client and retainer values
- Campaign performance: Impressions, clicks, and conversions across channels
- Client retention rate: How many clients renew their contracts
- Team utilisation: How effectively your team's time is being used
4. Course creator dashboard
Online course businesses combine sales, email, and content metrics:
- Course sales: Enrolments, revenue, and refund rates
- Email open and click rates: How your marketing campaigns perform
- Student completion rates: Are students finishing your courses?
- Website traffic: How many people visit your sales pages
5. Local business dashboard
Local businesses like dental clinics, gyms, and restaurants need simple, actionable dashboards:
- Bookings: Appointment volume and no-show rates
- Google Business Profile views: How many people find you on Google
- Revenue: Daily and weekly sales trends
- Customer reviews: Average rating and review volume
6. Content marketing dashboard
Content creators and publishers track audience growth and engagement:
- Page views: Total traffic and traffic by article
- Social media engagement: Shares, comments, and follower growth
- Email subscribers: New signups and list growth rate
- Top performing content: Which articles or posts drive the most traffic
7. Manufacturing dashboard
Manufacturing businesses track operational efficiency and output:
- Production output: Units produced vs. targets
- Downtime: Hours of unplanned stoppage
- Quality rate: Percentage of products passing quality checks
- Order fulfilment: On-time delivery percentage
8. Healthcare dashboard
Healthcare practices focus on patient outcomes and operational metrics:
- Patient volume: Daily and weekly appointment counts
- Wait times: Average time from booking to appointment
- Patient satisfaction: Survey scores and feedback trends
- Revenue per patient: Average billing per visit
9. Financial services dashboard
Financial advisors and accountants track client portfolios and business health:
- Assets under management (AUM): Total value of client investments
- Client acquisition: New clients per month and conversion rate
- Revenue per advisor: How much each team member generates
- Client retention: Percentage of clients who stay year over year
10. HR dashboard
HR teams track workforce metrics that impact the business:
- Headcount: Total employees, new hires, and departures
- Turnover rate: How many employees leave each quarter
- Time to hire: How long it takes to fill open positions
- Employee satisfaction: Survey scores and engagement trends
What makes a KPI dashboard effective?
Across all 10 examples, the dashboards that work share these traits:
Fewer metrics, more clarity. The best dashboards show 4 to 6 KPIs, not 20. Each metric earns its place by answering a specific question.
Trends over snapshots. A single number is meaningless without context. A trend line showing the last 12 months tells you whether things are improving or declining.
Actionable layout. The most important metric is at the top. Supporting metrics are below. Every chart has a clear label and purpose.
How to build your own KPI dashboard
Start by identifying the 3 to 5 questions you ask most often about your business. Then choose the KPIs that answer those questions. Look at examples in your industry for inspiration, but do not copy blindly. Your business is unique.
If you want a custom KPI dashboard built for your business, we design dashboards that pull data directly from your existing tools. Browse our dashboard examples to see what we have built for other businesses, or read our guide on business intelligence dashboards for a broader overview.
Want a KPI dashboard built for your industry?
We build custom KPI dashboards for businesses of all types. Tell us about your data and we will design something that fits.
Get a Free Quote →